Uncovering Momentum
In this post we review our latest studies leading to the explanation of the momentum premium, a long-term ongoing challenge. Documented in 1993 by Jegadeesh and Titman, the momentum phenomenon remained an open question with no single model dominating the narrative (Fama on Momentum, 2016). Our research transparently explains the momentum premium for 2010-2019 as the sampling of high volatility growth stocks. These results were derived through a sequence of two SSRN working papers.
The first paper “Momentum with Volatility Timing” highlighted the broken behavior of the conventional WML momentum factor during a market downturn and proposed past volatilities as a timing predictor for mitigating momentum factor underperformance within the context of time-varying multi-factor portfolios. Analysis of the broken momentum behavior triggered new questions rooted in the theory behind momentum. Therefore, the next paper “Uncovering Momentum” applied a systematic divide-and-conquer approach proceeding from the momentum factor into the stock level. The study encompassed a sequence of four steps: dissecting the momentum performance along bull/bear states and winners/losers deciles; comparison of conventional and time-series momentum portfolios; rolling intertemporal analysis, and clustering momentum decile time series. The corresponding top-bottom procedure narrowed down the scope of the study towards the intertemporal analysis of asset time series during transition periods between the ranking and holding intervals. The subsequent study then extended this analysis with the selection of characteristic-related anomalies as briefly overviewed in a TDS article.
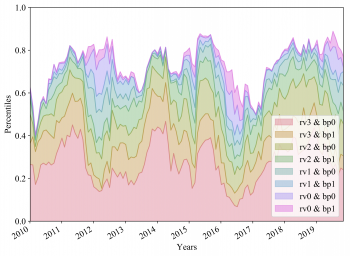
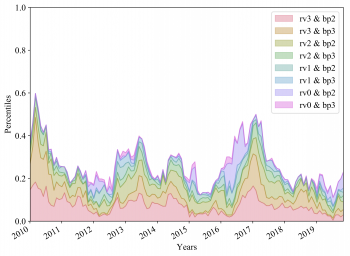
Defining a parsimonious subset of characteristics in general represents a complex time-varying tradeoff among multiple aspects. Therefore, the analysis was narrowed down to realized volatility and leveraging the Fama-French model encompassing size, value, and two quality factors. According to the study, a commanding proportion of stocks within the winners decile are concentrated in the top two realized volatilities and bottom two book-to-price quartiles. More specifically, growth stocks represent 76% and high volatility stocks 83% of momentum winners. These results therefore suggested to further focus on these two characteristics and explore their bivariate quartiles. The corresponding time-varying bivariate percentiles are demonstrated in Fig. 1 which clearly show the dominance of the high realized volatility growth quartile across the time interval with exception to low volatility intermissions during momentum downturns followed by spikes in value-related quartiles.
Figure 1: Bivariate Realized Volatility (RV) and Book-to-Price (BP) Quartiles within the Momentum Winners Decile 2010 to 2019.
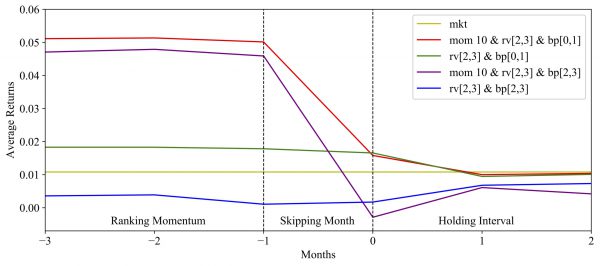
The results of Fig.1 suggested the natural assumption that the momentum winners decile represents the sampling of high volatility growth stocks. Therefore, to evaluate this hypothesis we continued the analysis by comparing the performance of momentum winners decile and full sample through tracing their corresponding quartiles across the ranking, one-month skipping, and holding intervals. The approach is illustrated in Fig. 2. Starting from the left side, the difference in the ranking period between momentum winners and full sample quartiles is determined by the high idiosyncratic returns sampled by the momentum procedure. Next, during the skip interval as the ranking period ends at lag month -1 on the plot, momentum winners approach the mean level of high volatility stocks. After the formation date, they both experience a similar short-term reversal. Interestingly, while the lagged one month was previously documented to experience short-term reversal, the results in the figure show that skipping the most recent one month and hence excluding it from the conventional ranking interval is no longer necessary. Excluding the month from ranking in this study however, was instrumental for gaining insight into the main drivers of the momentum effect by capturing the alignment between momentum winners and high volatility growth stocks.
Figure 2: Intertemporal Results for High Volatility Growth and Value Bivariate Quartiles Returns within the Momentum Winners Decile and Full Sample Across 2010 to 2019.
To summarize, the intertemporal analysis of the momentum winners decile transparently explains the 2010-2019 momentum premium as the sampling of high volatility growth stocks. Furthermore, the analysis leaves no room for other effects, such as additional selecting characteristics or behavioral biases. The contribution of high volatility assets is consistent with previous studies and the momentum procedure itself which is based on the selection of stocks with high positive returns. The anomaly between growth and value stocks is also consistent with the exceptional performance of growth stocks over the past decade as demonstrated by large-cap mutual funds and ETFs.


